The Coming Bond Bear Market… And What Comes Next
by David Stockman via International Man

If you didn’t think the $70 trillion global bond market was a train-wreck waiting to happen, surely last week’s yield surge was a wake up call. From the 2.15% close one week earlier, the 10-year yield soared to a peak of 2.50% just after mid-day last Friday; and that 36 basis point gain was, in turn, the culmination of a stunning 200 basis point rise from the cyclical low point (0.51%) recorded during July 2020.
Needless to say, an economy staggering under the weight of $87 trillion in debt, representing a record 365% of GDP, can’t take much interest rate increase in any case. But when the Fed is drastically behind the curve and will be forced to hit the brakes hard (and unexpectedly) in coming months, you are talking about a recipe for financial carnage.
Of course, the knuckleheads in the Eccles Building are just beginning to faintly recognize the trap they have backed themselves into. As Bill King aptly noted,
….contributing to the bond carnage on Friday morning: NY Fed President Williams said the Fed will hike rates 50bps if needed, and inflation has been much stronger than the Fed expected. What dopes!!
He got that right. However, also recently the UST 2–year hit 2.31% compared to 1.85% on the day before the Fed’s mid-March 25bps rate hike. So as King noted further,
Ergo, the 2–year note puts the Fed 21bps more behind the curve than when it hiked rates 25bs. As anyone around in the late ‘70s knows, once the Fed gets meaningfully behind the curve, baby steps are counterproductive. Only Volcker–like action works
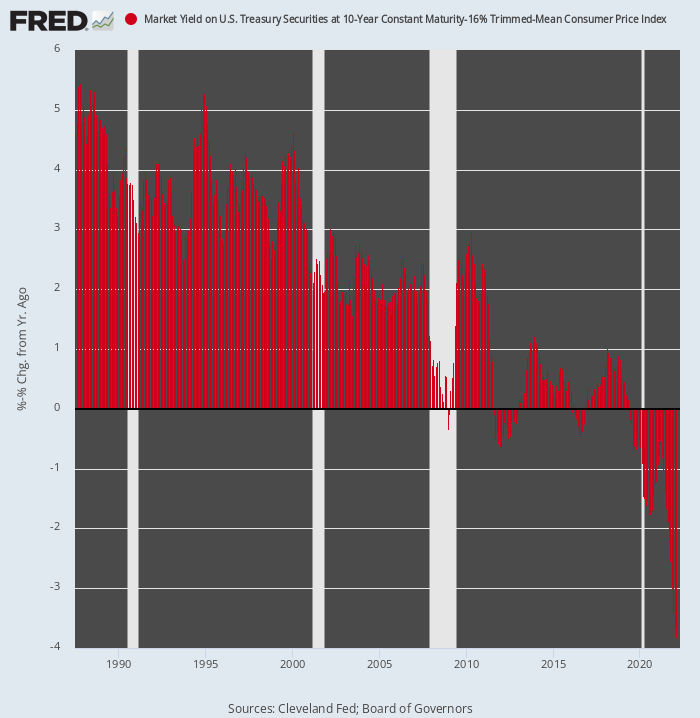
In fact, the term “Volcker-like action” is surely an understatement. As shown in the chart below, the Fed has literally buried the bond market in false economics. That is, ultra-low nominal yields which cannot possibly withstand the inflationary gales coming down the pike.
As of the end of February, the 16% trimmed mean CPI stood at +5.75% on a Y/Y basis, meaning that the real 10-year yield after inflation stood at a hideous -3.81%. But with inflation continuing to rise toward 10%, the handwriting is surely on the wall. To wit, last week’s yield surge was just a warm-up for the surges which lie ahead.
After all, the -3.81% real yield recorded in February 2022 not only defies rational economics, but it was also the culmination of a 35-year cycle of declining real yields like no other in recorded history.
From the 4.5% real yields prevailing when Greenspan took charge of the Fed in August 1987, the relentless hammer of money-printing at the Fed and other central banks had driven yields to an average of 3.5% during the 1990s; around 2% during 2000-2010, save for the plunge during the Great Recession; and then to increasingly negative real yields after Inflation Targeting was officially adopted in January 2012.
Inflation-Adjusted (Real) Yield On 10-Year US Treasury Not, 1987-2022
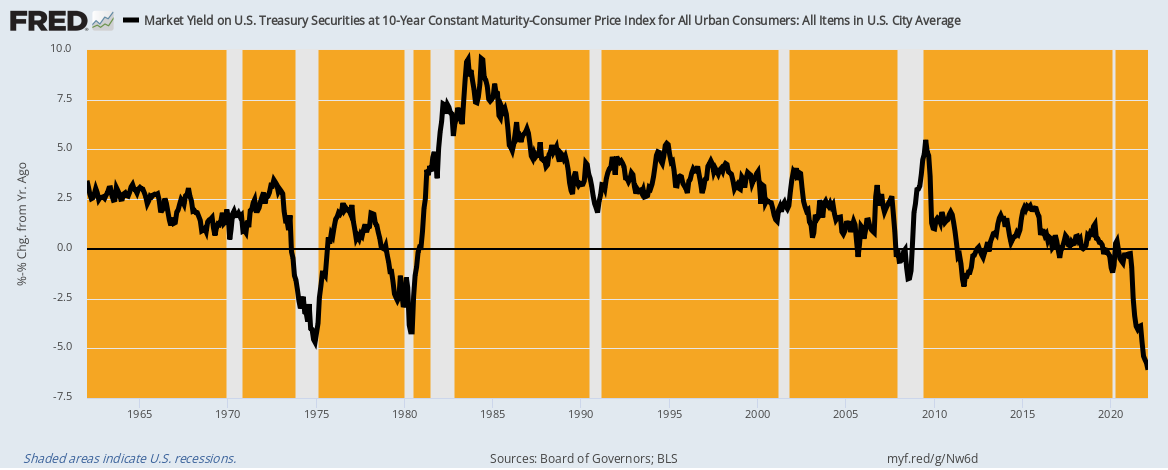
For want of doubt, here is the longer-term real yield based on the regular CPI (the trimmed mean doesn’t go back this far). There is nothing comparable in the last 60-years to the February 2022 real yield of -6.08% on a regular CPI basis. Even at the peak of the 1980s inflation blow-off the real yield only reached -4.18% and -4.70% at the top of the first oil crisis in December 1974.
In a word, the real yield on the world’s benchmark bond is in uncharted waters, no matter how you slice it. Indeed, yields are so artificially suppressed that once it becomes evident to the speculators and front-runners in the bond pits that the central banks’ bond-buying cavalry is not coming back anytime soon, it will be Katie-bar-the-door on yields and, consequently, lights out for TINA in the stock market, as well.
Inflation-Adjusted Yield on 10-Year UST, 1962-2022
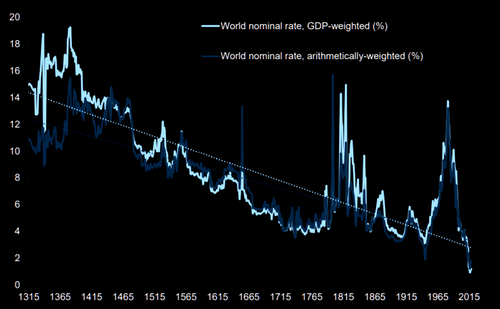
As it happens, moreover, this lowest real yield in 60 years is not the end of the story. It can actually be well and truly said that the biggest bond bubble in 800 years is now deflating, and that will make all the difference in the world.
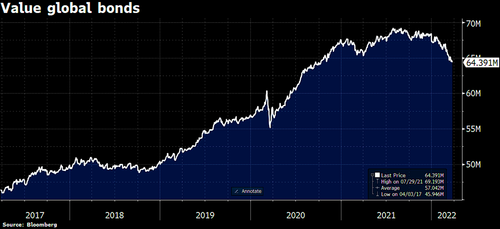
Moreover, the global bond market bubble is deflating at a fearsome pace. The value of global bonds dropped by another $754 billion just last week, bringing total loss from the recent all-time high in mid-2021 to a staggering $4.8 trillion or 7%.
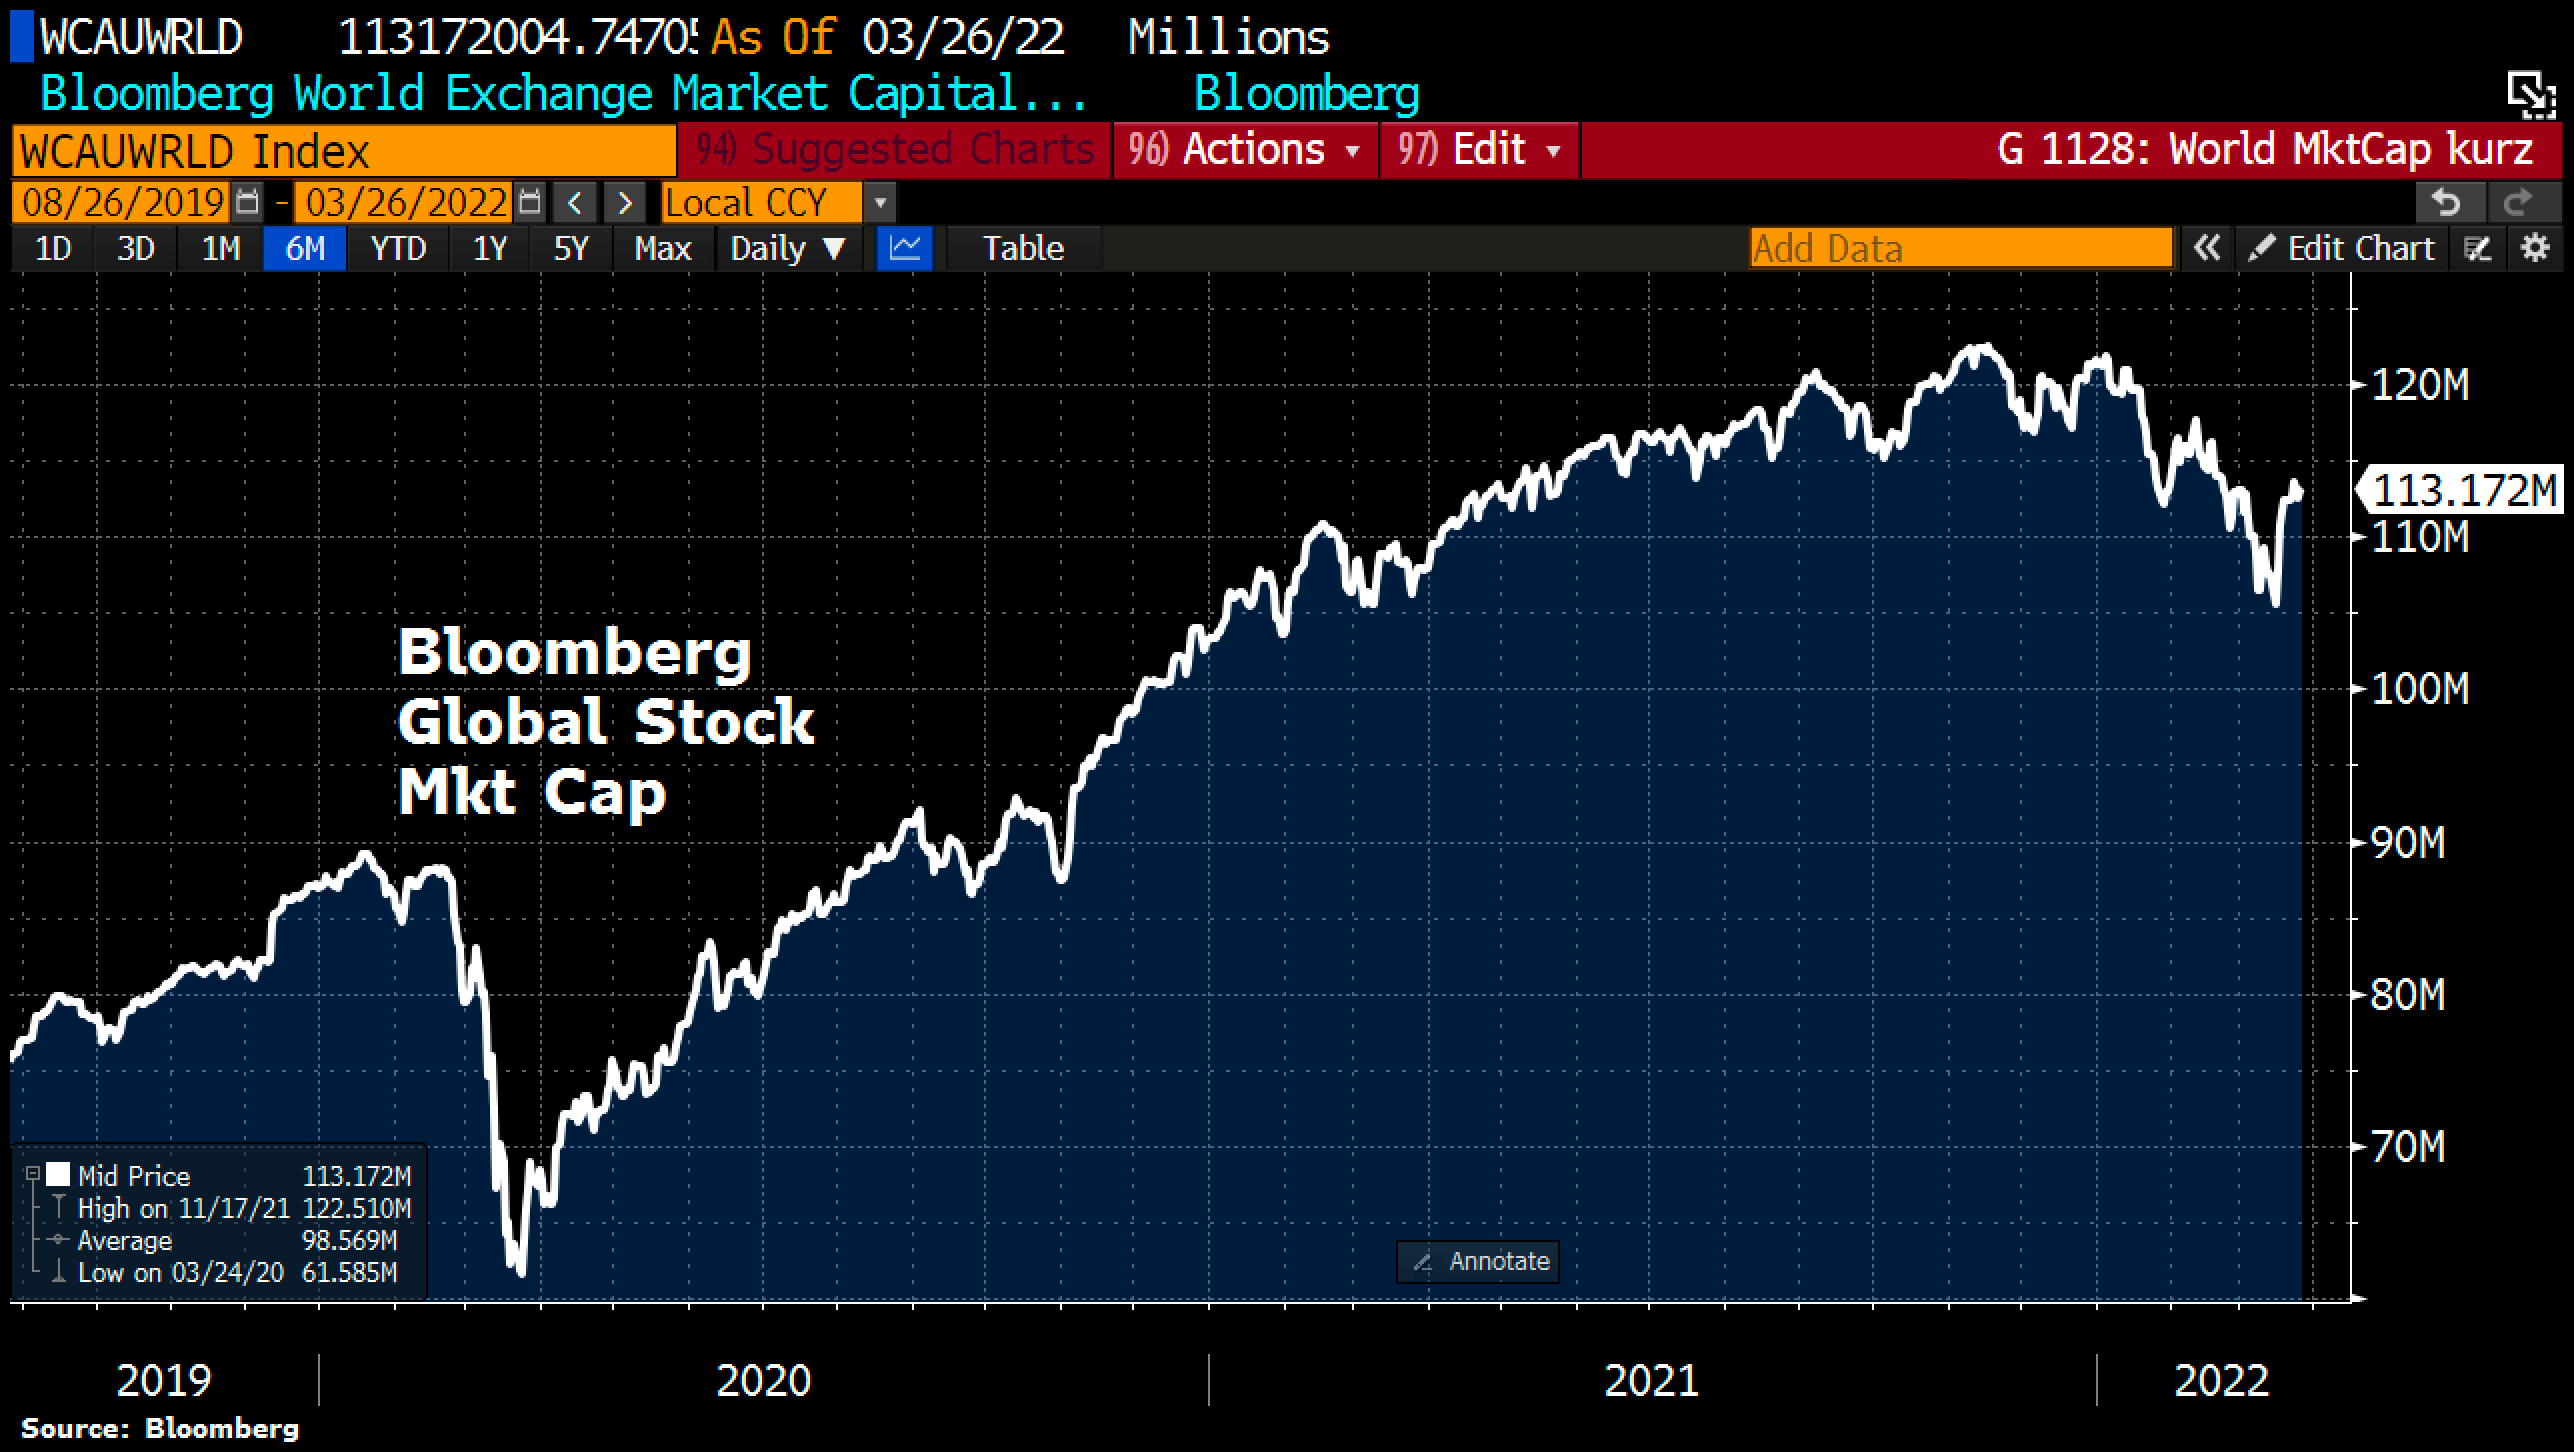
Needless to say, when this utterly distorted bond market heads south, the global stock market won’t be far behind. After all, current nosebleed levels and out of this world PE ratios are predicated on ultra-low yields and the specious theory of TINA (there is no other alternative to stocks).
Indeed, the global stock market capitalization level as computed by Bloomberg is off from its $122 trillion mid-2021 peak by $9 trillion or nearly an identical 7%. And the plunge has just gotten started.
After all, even at the current $113 trillion, global equity capitalization stands at 133% of global GDP, which is double the ratio that prevailed before the central banks jumped the shark with financial repression and stock market price-keeping after the turn of the century.
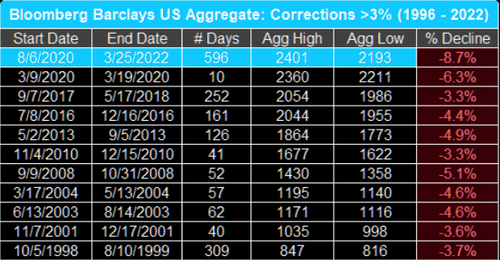
Stated differently we are now in what promises to be a world record bond bear market that is just finding its sea legs. Accordingly, the US bond market alone is down 8.7% from its peak in August 2020, making it already the longest (596 days) and largest correction in bonds that we’ve seen in recent history.
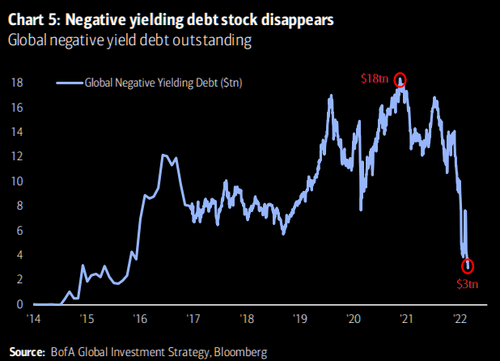
Looked at differently, recall when there were $18 trillion of negative yielding debt trading in world bond markets?
That number is already down to $3 trillion and heading vertically toward positive territory—-the only rational place for bond yields to stand. And as it corrects, there will be a world of hurt among corporate, household and government borrowers who had foolishly assumed that free money was a permanent condition.
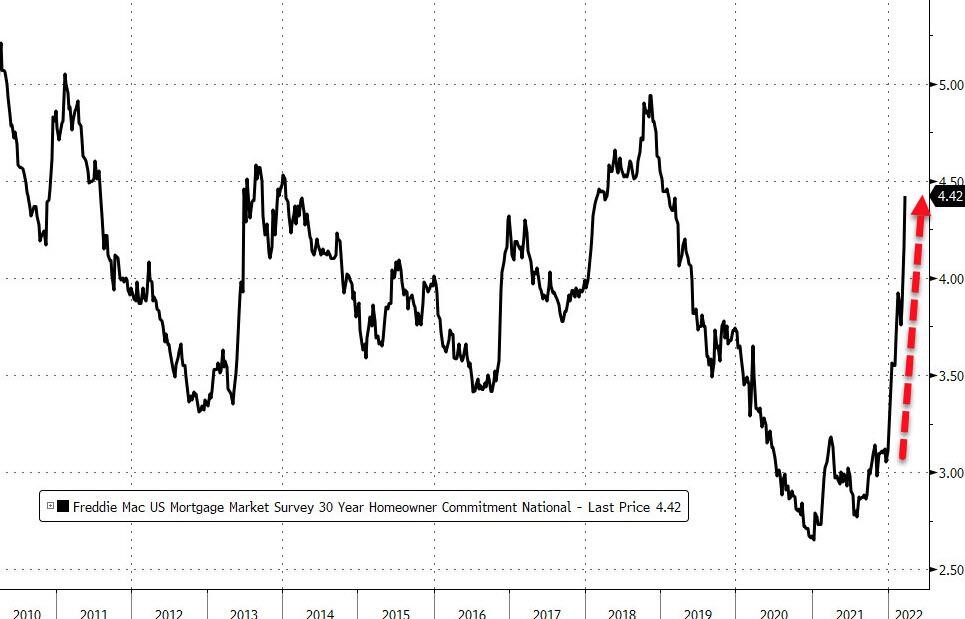
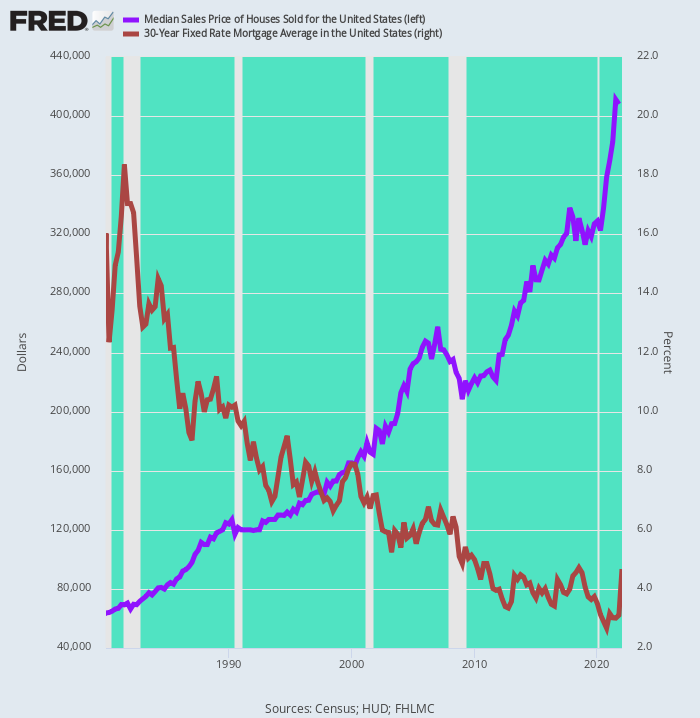
The benchmark yield, of course, does not exist in a vacuum—just the opposite. The Fed’s post-March 2020 printathon caused a radical plunge of mortgage rates, triggering a speculative run-up in housing prices. Now its reversing violently, and housing prices can’t be too far behind.
Freddie Mac 30-Year Mortgage Rate, 2010-2022
In fact, the whole beneficent housing cycle of the last 42 years is likely reversing. As shown in the chart, between 1980 and the first peak in 2006, housing prices rose by 295% as the 30-year mortgage rate plunged from 15% to 6%.
But the Fed was not nearly done. During the era of ZIRP and QE after the 2008 crisis, it drove the 30-year rate (red line) to a low of 2.67% in Q3 2021, thereby fueling a new housing price (blue line) surge of another 60% from the 2006 high.
But here’s the thing. In just the last two quarters, the 30-year rate has rebounded by 175 basis points to 4.42% from the 2021 low, thereby already cancelling 50% of the 350 basis point drop from the Q1 2007 level. So tumbling housing prices are surely next in line.
Median Home Sales Price Versus 30-Year Mortgage Rate, 1980-2022
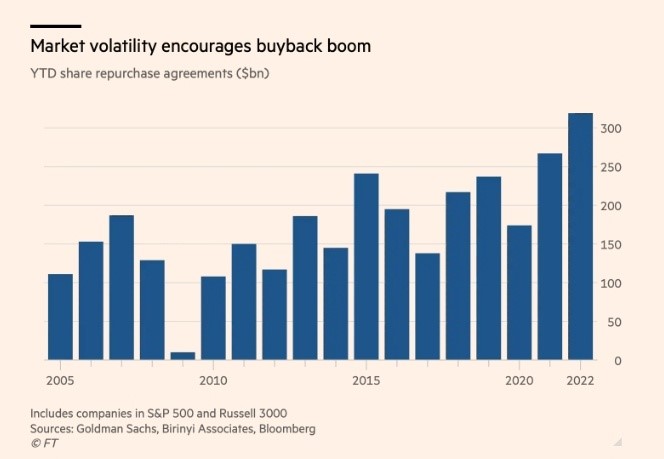
Nor is housing the only victim of the unfolding bond bear market. For the past 20 years the corporate sector has been systematically shrinking its equity base. That was the result of either applying cash flow that could have otherwise gone into productive investments or debt pay-downs into stock buybacks and dividend payments or actually borrowing to fund the same.
But now that bond yields are entering a secular trend of higher and higher levels in the slog back to normalcy and sustainability just the opposite it likely to happen. To wit, cash flow will be applied to productive investment or debt pay-downs, while borrowing to fund stock buybacks will become exceedingly rare.
Accordingly, the chart below is heading for a greater secular reversal. The estimated buyback level for Q1 2022 may well be the last hurrah for the Great Buyback Binge of the last two decades.
Needless to say, Wall Street is sleepwalking. As the bond bear gathers girth it will become increasingly obvious that we are early stages of a much larger, seismic shift not only in monetary policy, but in the state of the US economy.
Reprinted with permission from International Man.