Visualizing the State of Global Debt, by Country
by Raul Amoros and Christina Kostandi

View the expanded version of this infographic to see all countries.
Visualizing the State of Global Debt, by Country
Since COVID-19 started its spread around the world in 2020, the global economy has been put to the test with supply chain disruptions, price volatility for commodities, challenges in the job market, and declining income from tourism. The World Bank has estimated that almost 97 million people have been pushed into extreme poverty as a result of the pandemic.
In order to help with this difficult situation, global governments have had to increase their expenditures to deal with higher healthcare costs, unemployment, food insecurity, and to help businesses to survive. Countries have taken on new debt to provide financial support for these measures, which has resulted in the highest global debt levels in half a century.
To analyze the extent of global debt, we’ve compiled debt-to-GDP data by country from the most recent World Economic Outlook report by the IMF.
Debt-to-GDP ratio by Country: The Top 10 Most Indebted Nations
The debt-to-GDP ratio is a simple metric that compares a country’s public debt to its economic output. By comparing how much a country owes and how much it produces in a year, economists can measure a country’s theoretical ability to pay off its debt.
Let’s take a look at the top 10 countries in terms of debt-to-GDP:
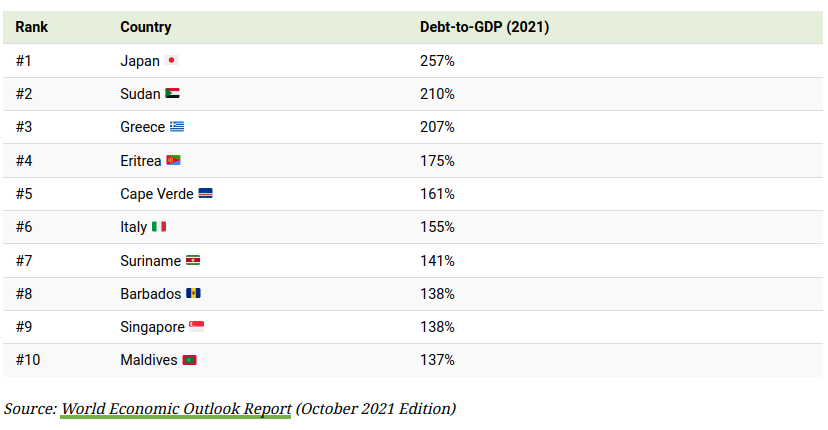
Source: World Economic Outlook Report (October 2021 Edition)
Japan, Sudan, and Greece top the list with debt-to-GDP ratios well above 200%, followed by Eritrea (175%), Cape Verde (160%), and Italy (154%).
Japan’s debt level won’t come as a surprise to most. In 2010, it became the first country to reach a debt-to-GDP ratio 200%, and it now sits at 257%. In order to finance new debt, the Japanese government issues bonds which get bought up primarily by the Bank of Japan.
By the end of 2020, the Bank of Japan owned 45% of government debt outstanding.
What is the main risk of a high debt-to-GDP ratio?
A rapid increase in government debt is a major cause for concern. Generally, the higher a country’s debt-to-GDP ratio is, the higher chance that country could default on its debt, therefore creating a financial panic in the markets.
The World Bank published a study showing that countries that maintained a debt-to-GDP ratio of over 77% for prolonged periods of time experienced economic slowdowns.
COVID-19 has worsened a debt crisis that has been brewing since the 2008 global recession. A report from the International Monetary Fund (IMF) shows that at least 100 countries will have to reduce expenditures on health, education, and social protection. Also, 30 countries in the developing world have high levels of debt distress, meaning they’re experiencing great difficulties in servicing their debt.
This crisis is hitting poor and middle-income countries harder than rich countries. Wealthier countries are borrowing to launch fiscal stimulus packages while low and middle income countries cannot afford such measures, potentially resulting in wider global inequality.
The IMF Warns of Interest Rates
Global debt reached $226 trillion by the end of 2020, seeing the biggest one-year increase since World War II.
Borrowing by governments accounted for slightly over half of the $28 trillion increase, bringing global public debt ratio to a record of 99% of GDP. As interest rates rise, IMF officials warn that higher interest rates will diminish the impact of fiscal spending, and cause debt sustainability concerns to intensify. “The risks will be magnified if global interest rates rise faster than expected and growth falters,” the officials wrote.
“A significant tightening of financial conditions would heighten the pressure on the most highly indebted governments, households, and firms. If the public and private sectors are forced to deleverage simultaneously, growth prospects will suffer.”
Editor’s note: All data used in our visualization was extracted from the World Economic Outlook Report (October 2021 Edition) and The World Bank. We will update this data when the new report is available in April 2022.
Reprinted with permission from Visual Capitalist.